103 lines
3.7 KiB
Plaintext
103 lines
3.7 KiB
Plaintext

|
---
|
||
|
|
title: Debugging Bun with the web debugger
|
||
|
|
sidebarTitle: Web debugger
|
||
|
|
mode: center
|
||
|
|
---
|
||
|
|
|
||
|
|
Bun speaks the [WebKit Inspector Protocol](https://github.com/oven-sh/bun/blob/main/packages/bun-inspector-protocol/src/protocol/jsc/index.d.ts). To enable debugging when running code with Bun, use the `--inspect` flag. Consider the following web server.
|
||
|
|
|
||
|
|
```ts server.ts icon="/icons/typescript.svg"
|
||
|
|
Bun.serve({
|
||
|
|
fetch(req) {
|
||
|
|
console.log(req.url);
|
||
|
|
return new Response("Hello, world!");
|
||
|
|
},
|
||
|
|
});
|
||
|
|
```
|
||
|
|
|
||
|
|
---
|
||
|
|
|
||
|
|
Run the file with the `--inspect` flag.
|
||
|
|
|
||
|
|
This starts a WebSocket server on port `6499` (pass `--inspect=<port>` to use a different port). Debugging tools connect to this server to introspect the running Bun process.
|
||
|
|
|
||
|
|
Bun hosts a web-based debugger at [debug.bun.sh](https://debug.bun.sh). It is a modified version of WebKit's [Web Inspector Interface](https://webkit.org/web-inspector/web-inspector-interface/), which looks familiar to Safari users.
|
||
|
|
|
||
|
|
```sh terminal icon="terminal"
|
||
|
|
bun --inspect server.ts
|
||
|
|
```
|
||
|
|
|
||
|
|
```txt
|
||
|
|
--------------------- Bun Inspector ---------------------
|
||
|
|
Listening:
|
||
|
|
ws://localhost:6499/204e4940-4a8b-4ebc-8fee-1c66926bbc21
|
||
|
|
Inspect in browser:
|
||
|
|
https://debug.bun.sh/#localhost:6499/204e4940-4a8b-4ebc-8fee-1c66926bbc21
|
||
|
|
--------------------- Bun Inspector ---------------------
|
||
|
|
```
|
||
|
|
|
||
|
|
---
|
||
|
|
|
||
|
|
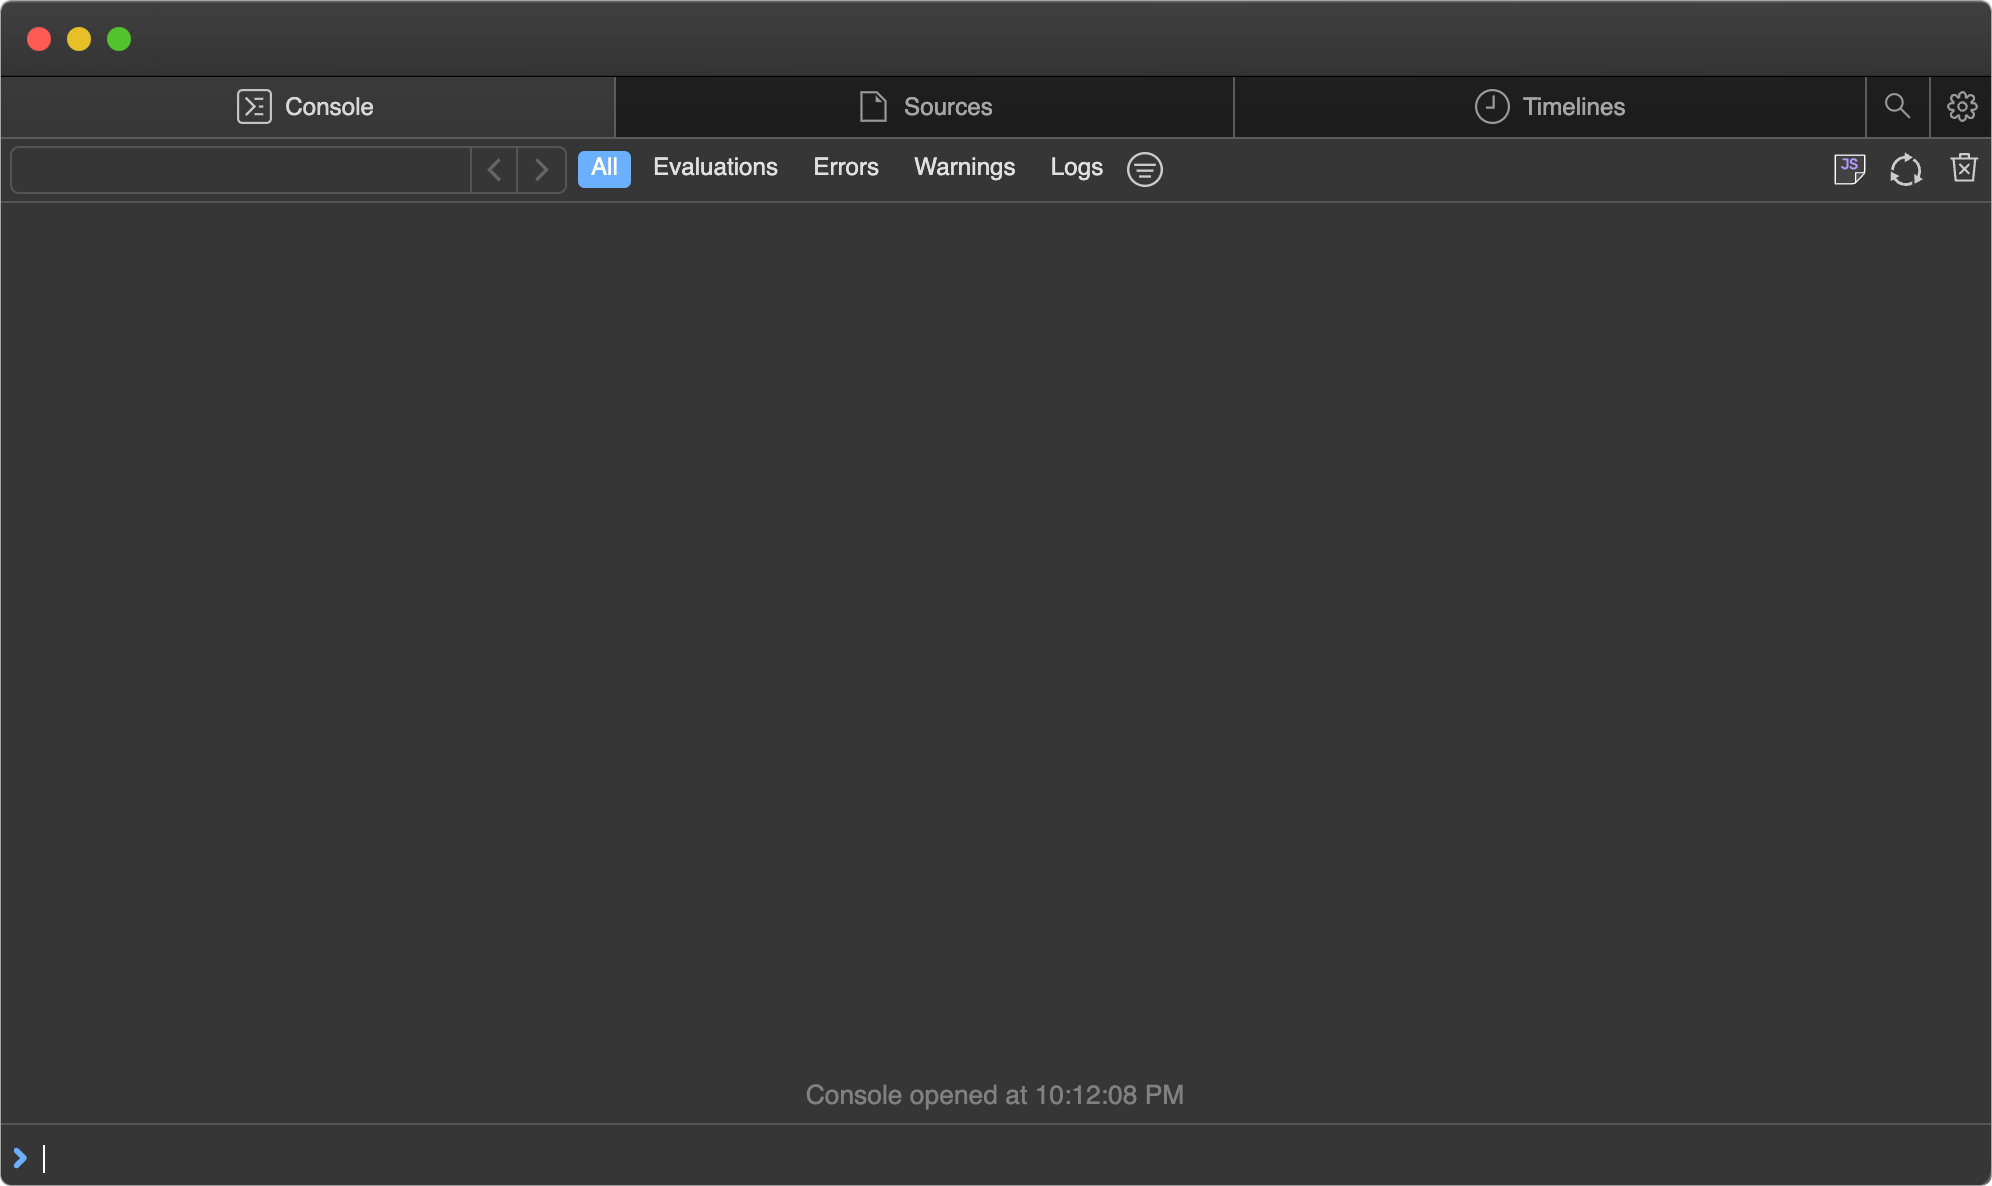
Open the provided `debug.bun.sh` URL in your browser to start a debugging session. From this interface, you can view the source code of the running file, view and set breakpoints, and execute code with the built-in console.
|
||
|
|
|
||
|
|
<Frame>
|
||
|
|
|
||
|
|
</Frame>
|
||
|
|
|
||
|
|
---
|
||
|
|
|
||
|
|
Next, set a breakpoint. Open the Sources tab, which shows the code from earlier, and click line number `3` to set a breakpoint on the `console.log(req.url)` statement.
|
||
|
|
|
||
|
|
<Frame>
|
||
|
|

|
||
|
|
</Frame>
|
||
|
|
|
||
|
|
---
|
||
|
|
|
||
|
|
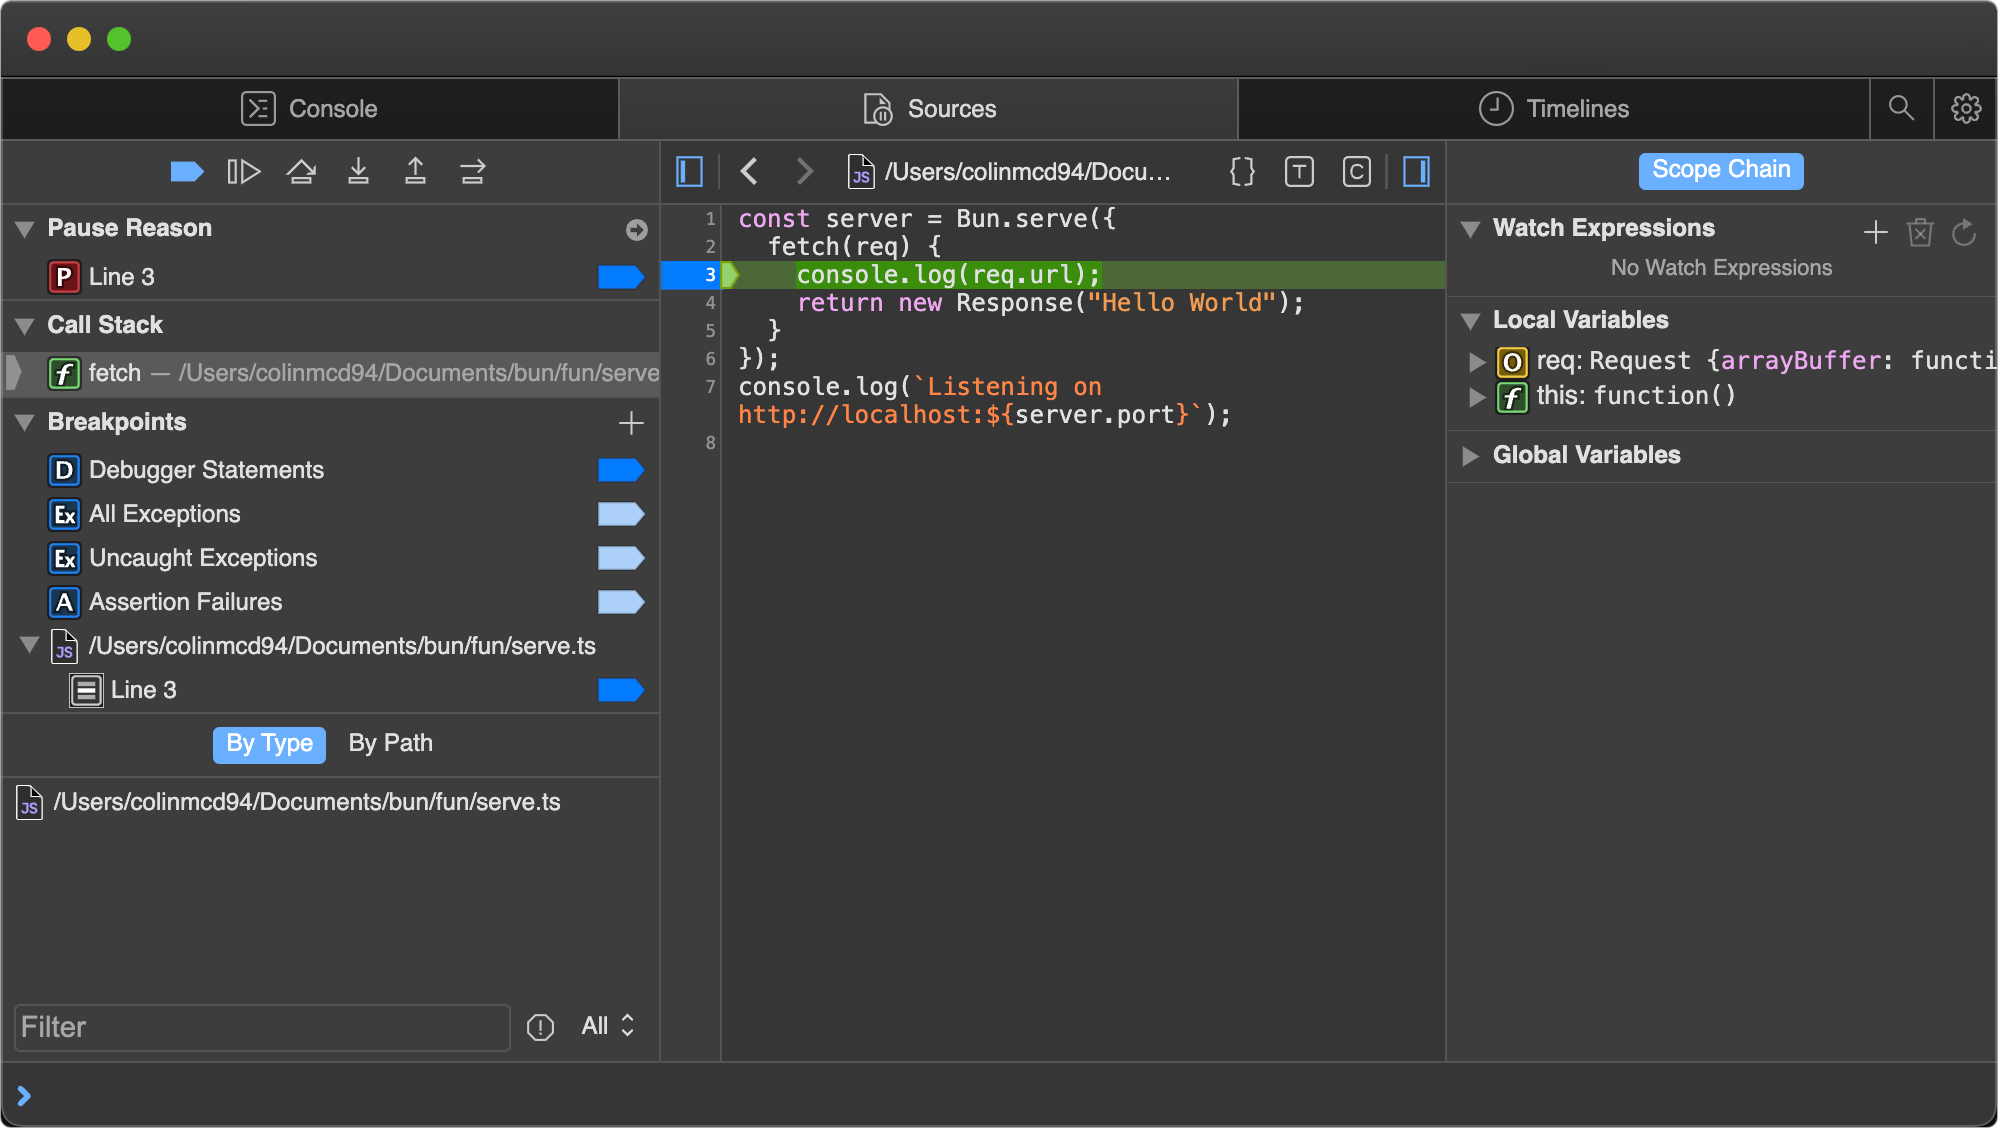
Then visit [`http://localhost:3000`](http://localhost:3000) in your browser to send an HTTP request to the server. The page hangs because the program is paused at the breakpoint you set.
|
||
|
|
|
||
|
|
Note how the UI has changed.
|
||
|
|
|
||
|
|
<Frame>
|
||
|
|
|
||
|
|
</Frame>
|
||
|
|
|
||
|
|
---
|
||
|
|
|
||
|
|
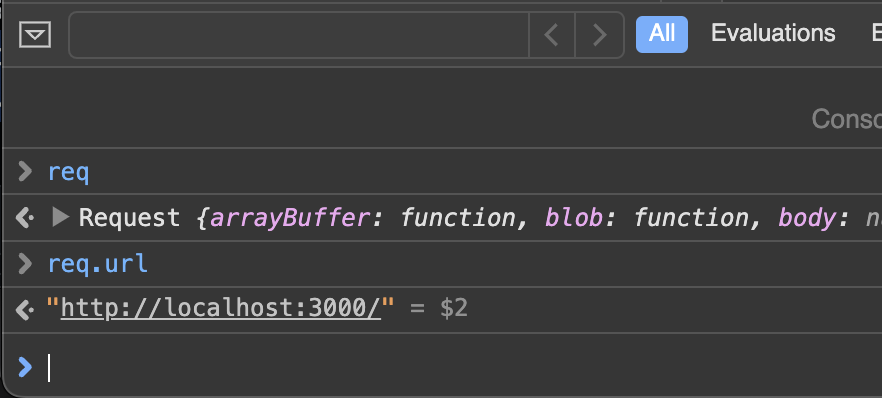
Use the console at the bottom to run arbitrary code in the context of the program, with full access to the variables in scope at the breakpoint.
|
||
|
|
|
||
|
|
<Frame>
|
||
|
|
|
||
|
|
</Frame>
|
||
|
|
|
||
|
|
---
|
||
|
|
|
||
|
|
The right side of the Sources pane lists the local variables in scope; drill down to see their properties and methods. The screenshot shows the `req` variable.
|
||
|
|
|
||
|
|
<Frame>
|
||
|
|

|
||
|
|
</Frame>
|
||
|
|
|
||
|
|
---
|
||
|
|
|
||
|
|
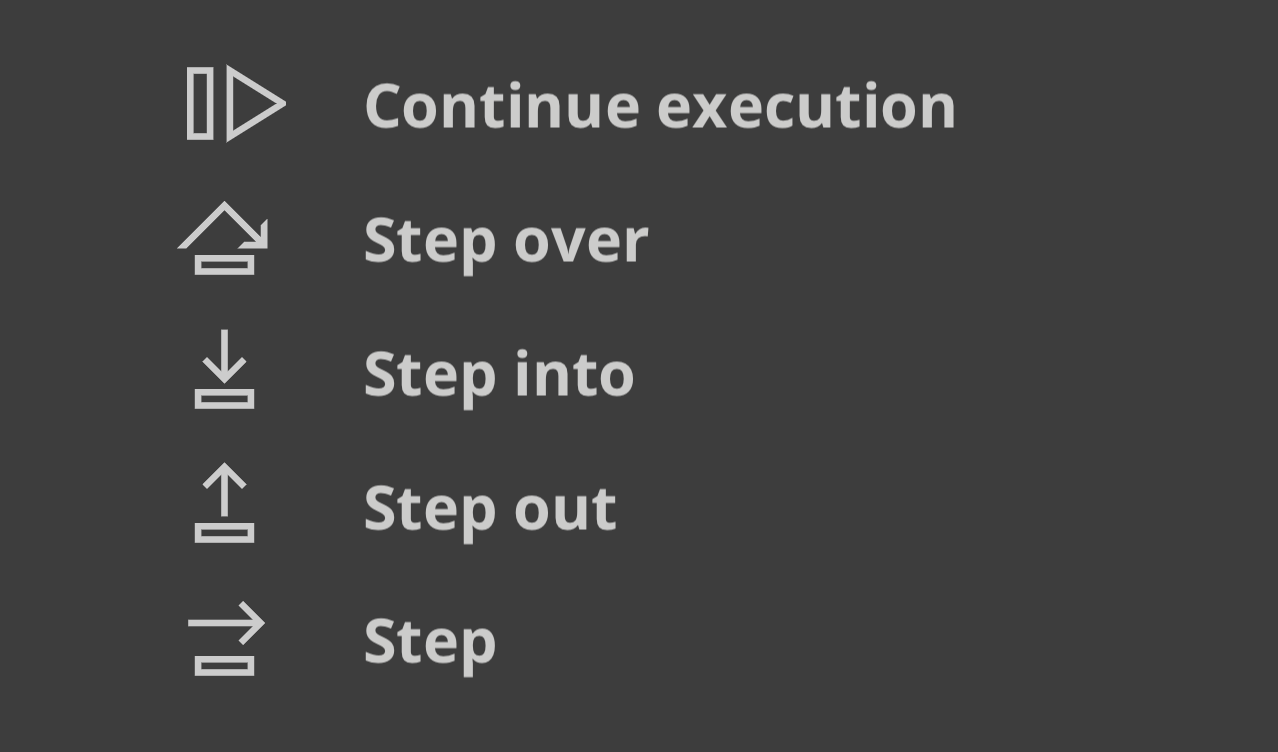
The buttons in the upper left of the Sources pane control the program's execution.
|
||
|
|
|
||
|
|
<Frame>
|
||
|
|

|
||
|
|
</Frame>
|
||
|
|
|
||
|
|
---
|
||
|
|
|
||
|
|
Here's what each control flow button does.
|
||
|
|
|
||
|
|
- _Continue script execution_ — runs the program until the next breakpoint or exception.
|
||
|
|
- _Step over_ — continues to the next line.
|
||
|
|
- _Step into_ — if the current statement contains a function call, steps into the called function.
|
||
|
|
- _Step out_ — if the current statement is a function call, finishes executing it, then steps out of the function to the location where it was called.
|
||
|
|
|
||
|
|
<Frame>
|
||
|
|
|
||
|
|
</Frame>
|